The COVID-19 lockdown. A breath of fresh air for Italy?
EUI researcher Risto Conte Keivabu illustrates the green effects of the economic lockdown during the COVID-19 crisis using data from the ESA’s Copernicus Atmosphere Monitoring Service.
Author:

Reading time: 6 min.
Introduction
Scientific research on climate change illustrates how human activity is directly linked to the pollutants released in the atmosphere. In Italy, the COVID-19 lockdown brought a rapid and sharp reduction in economic activities and traffic: a natural experiment for observing the ‘before and after’ results of the quarantine on air quality.
In this short article, I will try to understand how the lockdown has affected the quality of the air in Italy, answering three questions:
1) How has the lockdown affected the level of pollution in Italy?
2) How does pollution in 2020 compare to measurements from 2019?
3) What is the trend in one of the most polluted and populated provinces of Italy?
To do so, I use Copernicus Atmosphere Monitoring Service (CAMS) data from the 1st of January until the 19th of April 2020. The data is collected through images taken by the satellites of the European Space Agency (ESA) and elaborated by the European Environment Agency (EEA). In my analysis, I focus on the levels of Nitrogen Dioxide (NO2) calculated by micrograms per cubic meter air, taking the mean daily value for each province in Italy. This pollutant is chosen as it well captures the levels of human-made pollution in a single day and place.
How has the lockdown affected the level of pollution in Italy?
To answer this question, I compare pollution before and after the implementation of the national lockdown on 11 March.
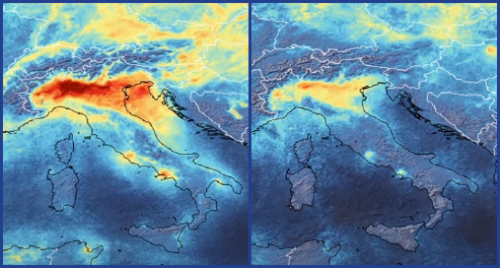
Figure 1 illustrates the reduction in pollution as the percentage difference in the mean levels of NO2 pollution measured before and after 11 March. While a few areas in the south and Sicily exhibited smaller decreases or even a slight increase, every other region enjoyed a decrease in NO2 pollution ranging from 19.8% to around 58%. Moreover, there is a high geographical variation with the northern and central regions, with most benefitting from cleaner air.
Figure 1 Reduction in NO2 pollution in Italy after the national lockdown by province

Figure generated using Copernicus Atmosphere Monitoring Service data from 2019- 2020 and elaborated with the softwares Python and STATA.
How does pollution in 2020 compare with pollution in 2019?
Figure 1 tells only part of the story, as air pollution tends to vary seasonally. In Italy, one finds higher levels in the winter due to the use of indoor heating, which contributes greatly to the total amount of pollution generated. Therefore, merely comparing the levels of mean daily pollution before and after the lockdown could lead to erroneous conclusions. For this reason, it is relevant to compare the 2020 trends with those of 2019.
Figure 2 demonstrates the levels of mean daily micrograms per cubic meter of NO2 measured in 2019 and 2020. The pattern in 2020 resembles the one in 2019, showing a continuous decrease. Noteworthy is the much steeper decrease observed in 2020, which lends support to the plausible effect of the lockdown.
Figure 2 Trends in N02 pollution in Italy in 2019 and 2020

Figure generated using Copernicus Atmosphere Monitoring Service data from 2019- 2020 and elaborated with the softwares Python and STATA.
How much better did the worst areas get?
Figure 1 highlighted that NO2 pollution sharply decreased almost everywhere in Italy after the lockdown, albeit not uniformly. With figure 2, I described how pollution diminished in 2020 due to the lockdown but following the usual seasonal trend present also in 2019. The figures show how factors such as population density, economic activity and seasonal temperatures also play a role in air pollution levels.
For this reason, I choose to zoom in on an area that arguably benefitted the most from the lockdown in terms of cleaner air: the province of Milan. This province is the second most populated in Italy, one of the most polluted and one of the areas hardest hit by COVID-19 pandemic. In figure 3, I present the trend in 2020 compared to 2019. In figure 3, one can be observe that the reduction in pollution in 2020 is more substantial than in 2019. This comparison is further evidence that the most polluted areas of the country are benefitting from cleaner air as a consequence of the lockdown.
Figure 3 Reduction in pollution in the province of Milan

Figure generated using Copernicus Atmosphere Monitoring Service data from 2019- 2020 and elaborated with the softwares Python and STATA.
What’s next?
The analysis has highlighted a substantial reduction in the levels of NO2 pollution in Italy after the COVID-19 lockdown. However, there are geographical differences in the reduction of pollution and provinces that have the highest density of economic activities, population and temperature variability show the highest reduction in NO2 particles, as I demonstrated with the case of Milan.
One of the few positive sides of the COVID-19 pandemic is the breath of fresh air that the lockdown brought to citizens in some heavily polluted areas of Europe. While the low emissions achieved during the lockdown will probably not last once industry reopens, this extraordinary period should stimulate us to reflect on how we can continue to grow economically developed areas without compromising the future of our planet.
This is no easy task: the low price of oil and the need to compensate for the losses of the economic crisis accumulated during the pandemic will probably not encourage sustainable and eco-friendly growth. Nonetheless, citizens should encourage policy makers to find the measures that not only help the international community recover from the global pandemic, but also build a greener future for the planet.
Risto Conte Keivabu is a PhD researcher at the EUI in the SPS department. His current research deals with the consequences of climate change on individual health and behaviour. More specifically, he is interested in the effects of stress caused by heat and pollution on individual outcomes and how sociodemographic characteristics moderate the impact.
Sources: The figures have been generated using Copernicus Atmosphere Monitoring Service data from 2019- 2020 and elaborated with the softwares Python and STATA.